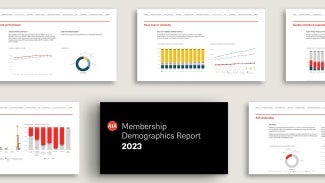
AIA Membership Demographics Report
This report is a benchmark to measure changes in AIA’s member demographics. It includes member-reported data for all AIA membership categories plus demographics for the AIA Board of Directors, AIA Strategic Council, and AIA headquarters staff.

New! 2023 Demographics report
AIA is committed to advancing diversity and equity in architecture and design through the intentional recruitment and retention of people with underrepresented backgrounds. The 2023 edition of the AIA Membership Demographics Report shares an overview of AIA programs and initiatives that support our diversity efforts—designing for equity and creating a sense of belonging at AIA.
The report aggregates key demographic trends for AIA’s membership, Board of Directors, Strategic Council, and headquarters staff.
Key findings from the report
Race and/or ethnicity
In 2023, 18.9% of AIA members did not report race or ethnicity, which impacts our ability to show trends. However, there are data points that reveal trends.
- The percentage of reported underrepresented racial and ethnic groups grew 5.7-points between 2013 and 2023 to 17.9%.
- The overall membership trends in underrepresented racial and ethnic groups reflect the Architect member demographics, with growth among Asian, Black or African American, and Hispanic or Latina/o members.
- 33.3% of associate members self-identify from an underrepresented race and/or ethnicity, which is at a higher rate than overall membership and up 12.4-points from 2013.
- In 2022, NAAB reported 43% of graduates were from underrepresented racial and ethnic groups, while the remaining graduates were white (39%) and international students (16%).
- NCARB reports that of the people completing the ARE in 2022 17% identified as Hispanic or Latino, 18% as Asian, and 6% as Black or African American.
Gender identity & expression
AIA’s membership has become more gender diverse over time, attributed in part to several key factors.
- Gender diversity within overall AIA membership has continued to grow, with the share of women increasing from 17.2% in 2013 to 26.8% in 2023.
- Trends in gender diversity for Architect members are comparable to those in the overall membership, with the percentage of women increasing from 16.1% to 25.7% between 2013 and 2023.
- In 2023, 40.5% of Associates reported their gender as women—higher than the overall membership share of 26.8%.
- Since 2023, more than 1,600 AIA members have self-identified as LGBTQIA+.
- NAAB reports that women made up slightly more than half of enrolled students and graduates from NAAB-accredited architecture programs in 2022, indicating gender diversity in the pipeline.
Age
The median age of members remains stable; however, there is growth among older and younger cohorts. In 2023, the median member age was 51, about where it has been since 2013 (51). However, the percentage of members above the age of 60 has increased by 4.5 points since 2013, while those aged 20–39 has increased by 3.2 points. The percentage of members in the 40–59 age range, which contains our current median, has shrunk by 3.3 points since 2013.
About the report data
Although AIA’s membership is an extensive community of more than 98,000 architecture and design professionals, participation in AIA is not mandatory to practice and not all AIA members are licensed in the United States. Therefore, any current and future reporting of AIA members should not be construed as a census of the entire profession.
Additionally, reporting demographic information to AIA is not a prerequisite for membership and is strictly voluntary, and some members choose not to disclose their race and/or ethnicity, gender identity and expression, or age. In some cases, nonreporting makes it challenging to fully determine AIA’s member demographics.
Past reports
The 2022 Membership Demographics Report
The 2021 Membership Demographics Report


